Summary
Observations
Tax-exempt capital market behaviors consistent with an early April snowstorm (i.e., not so good):
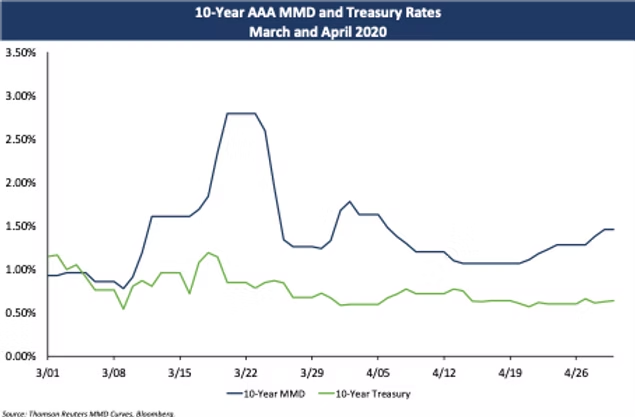
Between March 10-20, the 10-year tax-exempt fixed rate benchmark index (MMD) increasing by 201 bps.
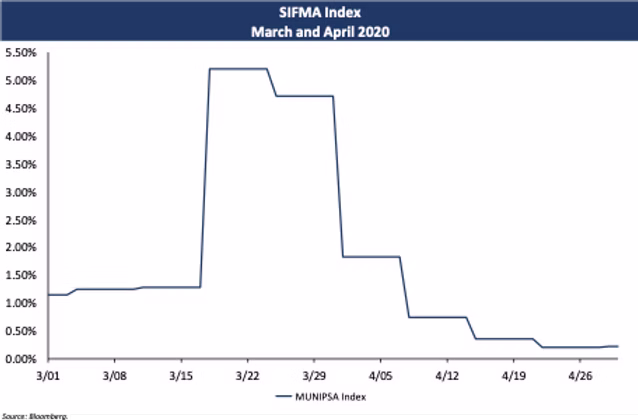
SIFMA trading in a 500-bp range over the course of a month.
– Even worse, individual VRDBs trading significantly higher than the SIFMA index over that same period.
Multiple instances of a meaningful 10+ basis point increase to the tax-exempt benchmark index (MMD) on days when taxable rates declined, including this week on April 28th.
Inflated tax-exempt to taxable ratios that indicate tax-exemption is not obtaining its true value.
– 10-year tax-exempt to taxable ratio is currently at 228%.
Tax-exempt capital market behaviors consistent with a 50-degree, cloudy day (i.e., about average):
Some secondary trading activity leading to market stability but no changes to benchmark indices, such as occurred yesterday on April 30th.
Tax-exempt capital market behaviors consistent with a 70-degree, sunny day (i.e., these make me happy):
Between March 24-30, the 10-year MMD decreasing by 155 bps.
Meaningful (10+ basis point) one day declines in the benchmark index (MMD) occurring in late March and early April.
SIFMA resets approaching their taxable index counterparts.
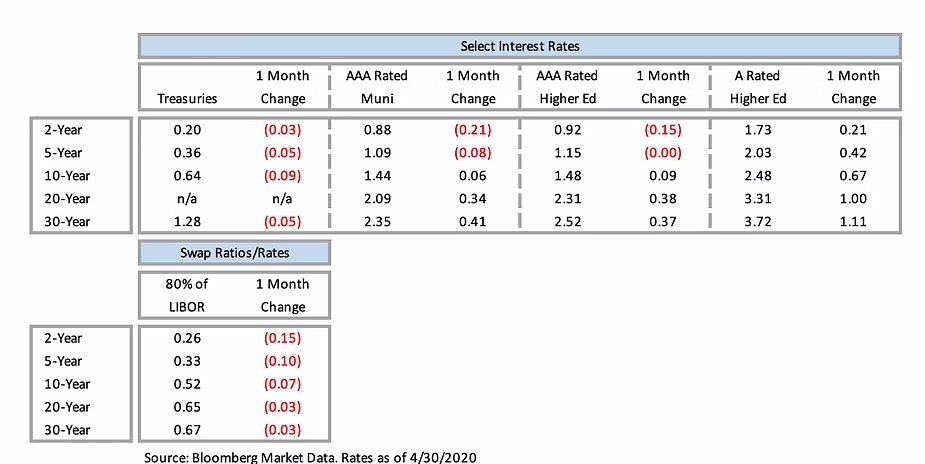
– As of April 30th – SIFMA at 0.21% vs. effective Fed Funds rate at 0.04%.
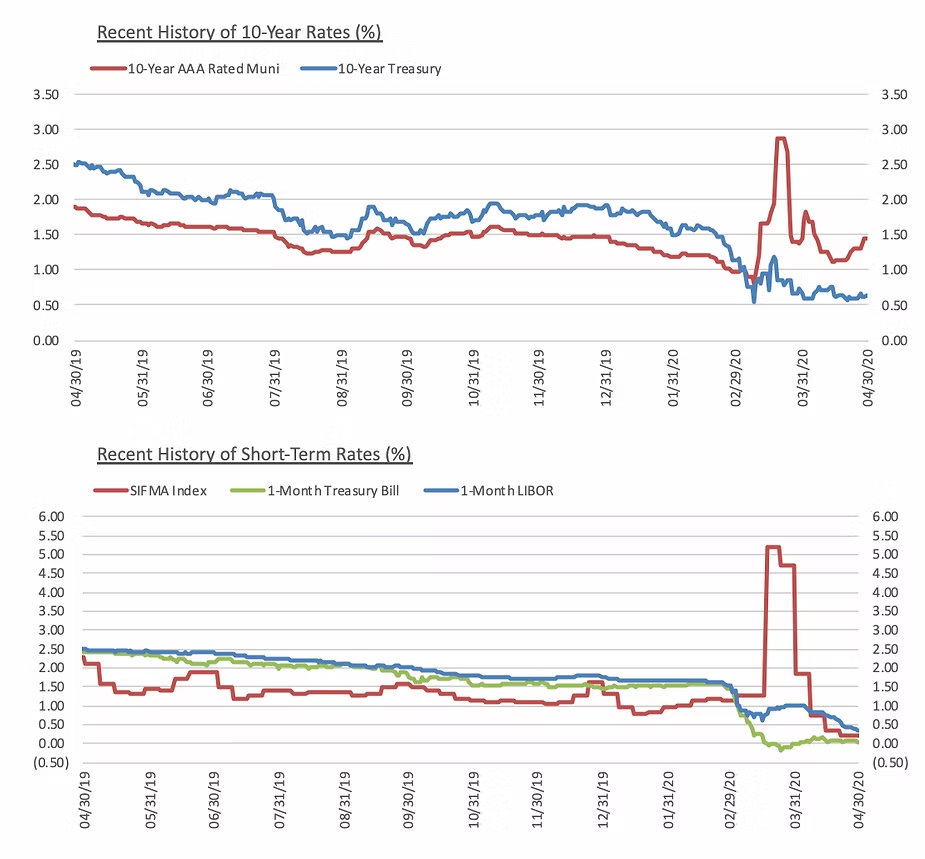
The following charts reflect the erratic trading patterns described above.
Advocacy and, Hopefully, Sunnier Days Ahead
About the Author:
Mr. Kelly holds a bachelor’s degree in economics from Amherst College and a master’s degree in theological studies from Bethel University. Mr. Kelly is a Series 50 qualified municipal advisor representative and Series 54 qualified municipal advisor principal.
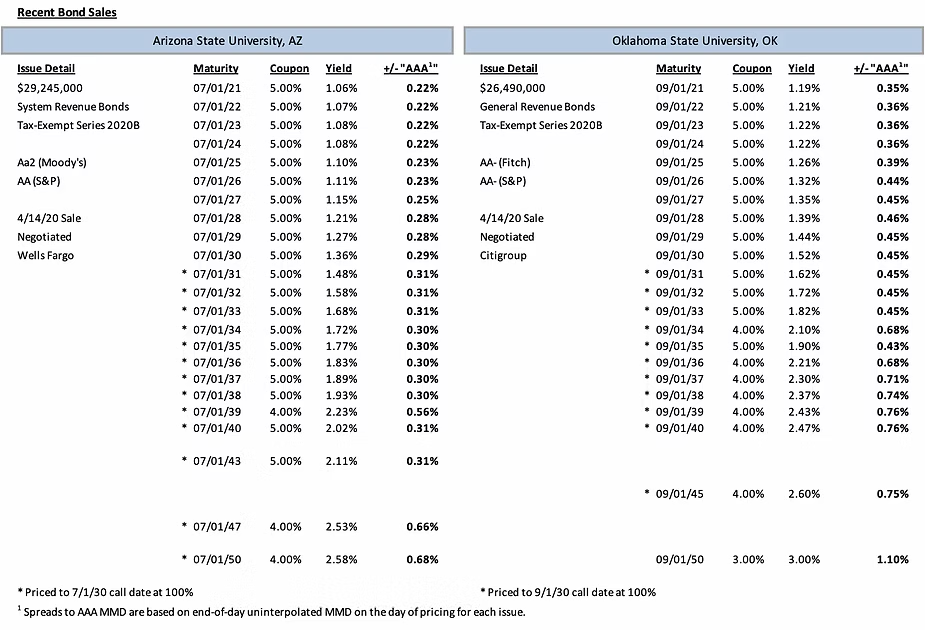
Comparable Issues Commentary
Despite the substantial volatility the municipal market has experienced recently with regard to credit spreads and absolute rates on both tax-exempt and taxable issues, it appears the bond sales of ASU and OSU were timed quite well. April 14th, the day both universities priced their deals, was the last in a streak of 7 straight business days of MMD reductions across the yield curve. Over that stretch, MMD rates fell anywhere from 43-79 bps depending on tenor, a substantial rebound from their spike in late March, and ultimately a “nadir” during the crisis given the gradual rate increase across the MMD curve that has occurred in the second half of the month. Credit spreads for both transactions were fairly stable as well given the market volatility, with callable 5% coupons pricing at spreads of 30-31 bps for ASU and 43-45 bps for OSU.
Both transactions were fully serialized through 2040, with term bonds utilized over the remaining 10 years leading up to their final maturities in 2050. The issues did differ slightly in coupon structure, with Arizona State predominantly using 5% coupons on its callable maturities until its final two terms in 2047 and 2050, while Oklahoma State used 4% coupons much more heavily from 2036-2045, along with a 3% par coupon in its 2050 term maturity. Both series were sold with a standard 10-year par call option. Oklahoma State’s 2020B bonds were structured for level debt service over 30 years, while Arizona State’s 2020B issuance was structured for level debt service over a 20-year period at just over $2M/year before stepping down to just over $1M/year for the final 10 years of maturities.
Interest Rates