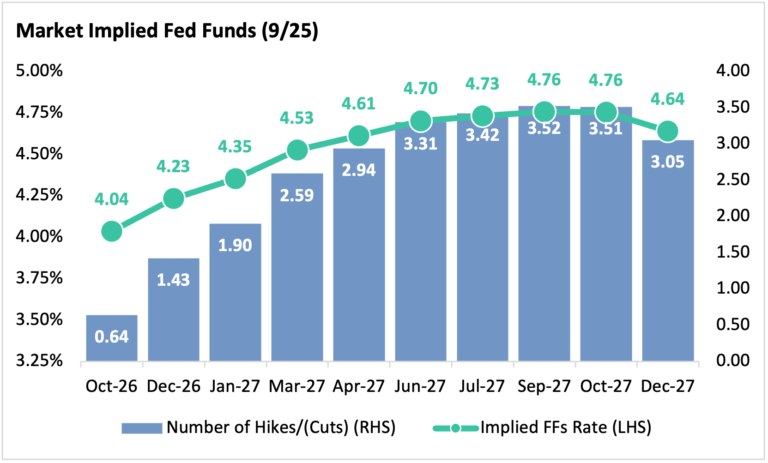
On September 16, the Federal Open Market Committee raised the target range for the federal funds rate by a quarter point to 3.75%–4.00%, its first increase since 2023. The Committee’s updated projections, Wall Street economists’ expectations, and rate futures markets are converging on another hike before year-end, with futures pricing in three hikes by the end of 2027. The market’s message is “higher for longer”: as of September 25, the 1-month Treasury bill yielded 4.04%, the 3-month 4.24%, and the 1-year 4.50%.
While refunding savings have been reduced due to increased rate levels in the taxable and tax-exempt space, the shape of the yield curve may be a redeeming factor for borrowers and issuers preparing for a refinancing or a cash defeasance. The first few years of the yield curve generally determine what a defeasance escrow can earn, and just as importantly, it determines whether State and Local Government Series (SLGS) securities or open market securities (OMS) will produce the better result.
A critical difference between SLGS and OMS escrows in that sector of the curve is the tenor of the underlying securities, which is determined by timing of the execution. When an issuer bids out an OMS portfolio for a refunding escrow, the portfolio yield is set on the day the bonds are priced. By convention, that is roughly two weeks to a month before closing, when the issuer receives the proceeds. To lock in that yield, the winning dealer buys the portfolio on the pricing date and finances the position until closing. By contrast, although SLGS rates are locked in at pricing, the rates used are for securities with maturities measured from the closing date rather than from the pricing date. As a result, the tenor of an OMS portfolio can often be as much as two to four weeks longer than that of the pricing tenor of an equivalent SLGS escrow. As the yield curve continues to steepen, this difference will become more profound in favor of an issuer/borrower.
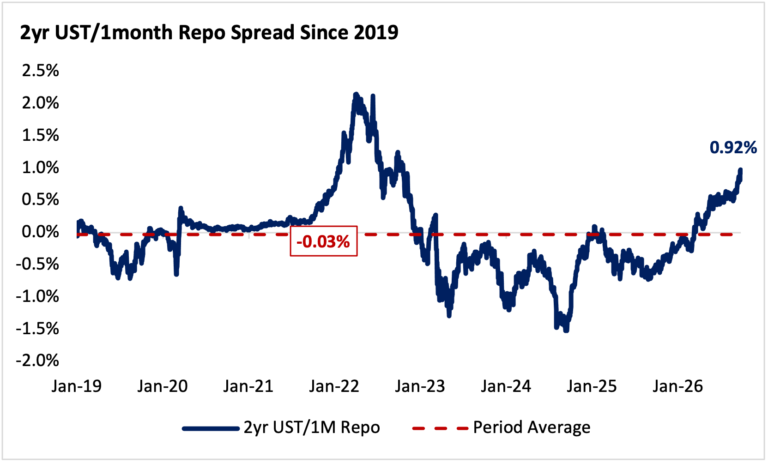
When the front end of the curve is inverted, as it was for much of the period from January 2024 through mid-2026, not only do the shorter SLGS securities have a higher interest rate, but the cost for the dealer to finance the position from purchase to close is higher than the yields earned on the longer-dated OMS portfolio. The dealer passes that negative carry on to the issuer through a lower portfolio yield. That has been another reason SLGS have often been the more attractive option in recent years.
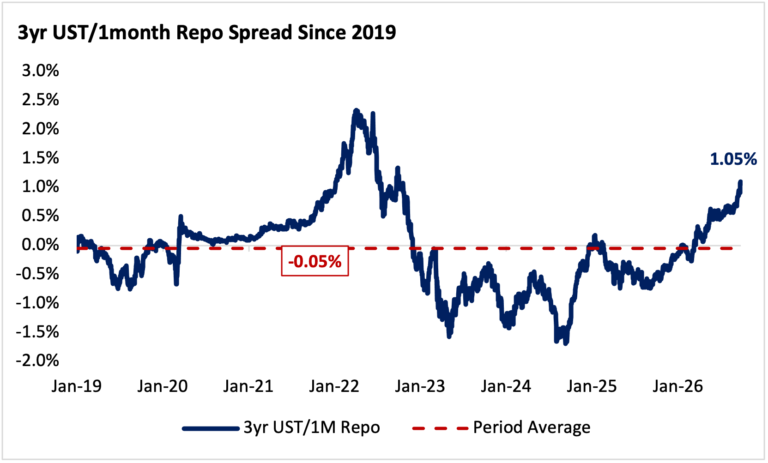
These dynamics have now reversed. The spread between the 2-year Treasury yield and 1-month repo averaged -34 basis points from January 2024 and bottomed at -152 basis points in September 2024. It turned positive in March 2026 and stood at 92 basis points as of September 25. The 3-year Treasury/1-month repo spread followed the same path, averaging -38 basis points since January 2024 with a low of -169 basis points before rising to 105 basis points. Closer to the escrow window, the 1.5-month/1-month spread, a rough proxy for the yield OMS earns over SLGS, stood at 10 basis points as of September 25, while the 2-month/1-month spread stood at 16 basis points. Positive carry gives dealers more room, and more incentive, to bid competitively. Combined with higher, steeper short-term rates, the extra duration provided by OMS earns a higher rate, so today’s market rewards OMS twice, through positive dealer carry and through higher yields relative to SLGS.
Meet the Author
Noah Rosenbaum | nrosenbaum@blueroseadvisors.com | (320) 460-1642
In his role as Analyst, Noah Rosenbaum provides analytical, research, and transactional support to the lead advisory team serving higher education, non-profit, and government clients with debt and derivatives advisory and reinvestment services.
Prior to Blue Rose, Mr. Rosenbaum worked for the Arns Davis Law Firm as an intern where he assisted attorneys by preparing deposition summaries and organizing case information for active litigation matters.
Media Contact:
Laura Klingelhutz, Marketing Coordinator
952-208-5710