After a whirlwind 2022, many had hoped for calmer markets in the first quarter of 2023. While the overall performance of the market was positive, the first few months of the new year were anything but calm. We saw stubborn inflation, substantial interest rate movement, and the first significant banking crisis since the great recession. The municipal market continued to follow trends that we identified in our market update last quarter as well. Issuance volume was lower relative to the last few years, particularly for taxable deals and deals in the “Baa/BBB” rating category and lower on the credit spectrum. Spreads and absolute yields also continued to widen, and we saw outflows from municipal bond funds, driven in large part by rich tax-exempt/taxable ratios compared to historical norms (with MMD dropping well below U.S. Treasuries across most of the yield curve). While significant challenges still exist in the market, the news is not entirely “doom and gloom.” Despite heavy volatility, equity markets notched modest gains and benchmark interest rates fell from the highs they reached in February, although they have ticked upwards again modestly in the last several weeks. As we look ahead to the second quarter of 2023, some of the key market trends Blue Rose is focusing on include:
Inflation
The April Consumer Price Index report showed a year-over-year increase of 5% and an increase of 0.1% in March. While this is still significantly higher than the 2% level targeted by the Fed, it does offer some evidence that the rate hikes seem to be working to gradually reduce inflation. Economists are expecting CPI to continue to decline through the course of the year to around 3.3% in the fourth quarter. As the market projected, the Fed again hiked rates by 25 bps rate hike at its May meeting, but softened its language on additional rate increases, opening the door for an end to the rate hike cycle we have seen of late. However, comments from Chairman Powell suggested that cuts to rates might not begin as soon as the market might have previously expected. Ultimately, whether over the short- or mid-term, falling rates would be good news for the higher education bond market as a whole, as higher rates coupled with rising credit spreads have evaporated refunding savings and sidelined some new money financings as well.
Interest Rate Movements
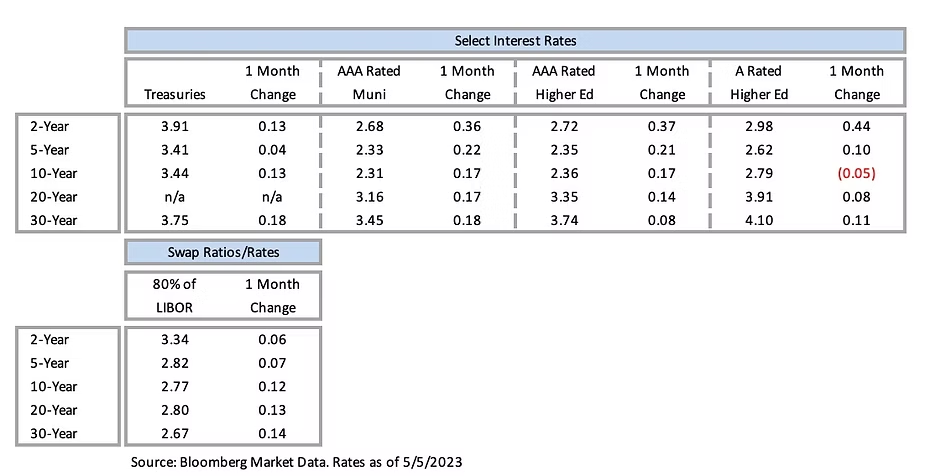
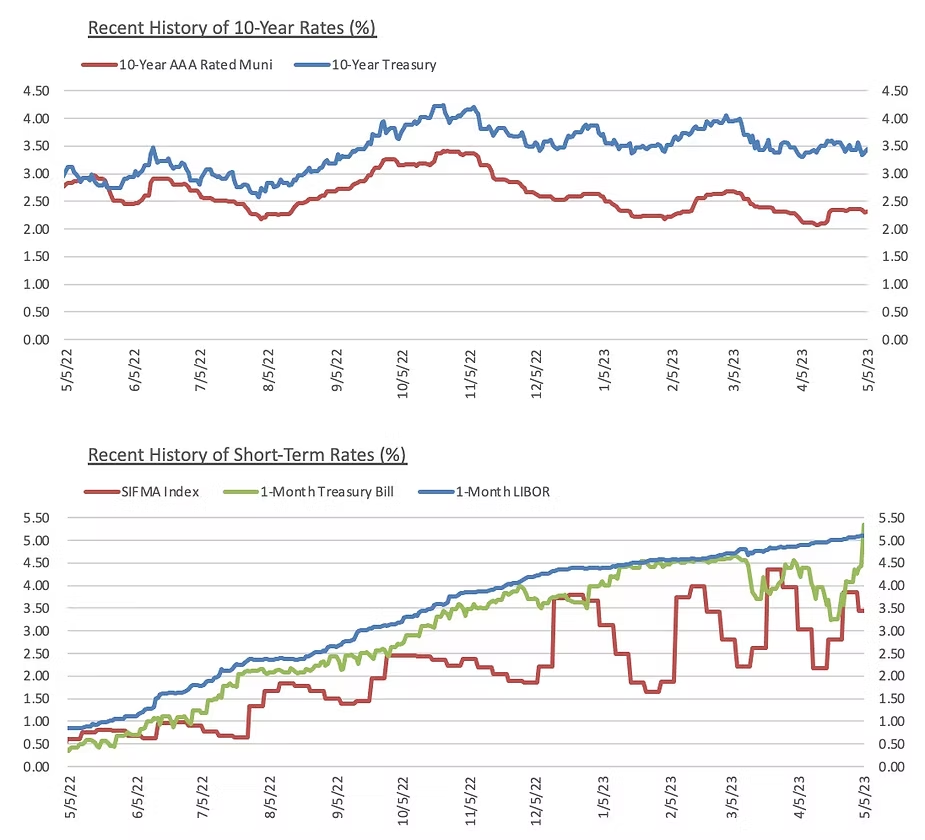
The Federal Reserve has raised the benchmark interest rate by 25 basis points twice since the beginning of 2023, increasing the Fed Funds rate from 4.50% to 5.00%. These hikes have come as the Fed continues its efforts to stamp out the decades-high inflation that emerged from the COVID-19 pandemic. While the Fed has continued hiking rates, the 25 bps increases this year are far less aggressive than the multiple 50 and 75 bps rate hikes that came last year. However, the additional hikes this year have only been one factor contributing to further decreased issuance volume from the already-lower levels seen in 2022. There have been 22 negotiated tax-exempt higher education issuances of greater than $25 million through April 14th which is less than half of the 48 deals priced through the same period in 2022. In the taxable market the discrepancy is even wider, with 24 taxable higher education deals priced through mid-April in 2022 compared with only three so far this year.[1] Other than in the first two years (which rose slightly from 12/31 levels), the MMD benchmark index fell by 3-33 bps since the end of 2022, with declines of at least 20 bps in years 5-30. Treasury rates from the 2-year out to the 30-year point fell between 21-59 bps from the end of 2023 through early May while the 1-year rate ticked higher by 3 bps, indicating continued recessionary fears even as interest rates are expected to remain elevated in the near term.
Banking Sector Instability
Bank failures made headlines in the first quarter for the first time in recent memory. While this crisis appears far less damaging to date compared to 2008, the failures of Silicon Valley Bank and Signature Bank in March, along with the winddown of Silvergate Bank, sent rippling effects through the global financial system. While bank failures are not a new occurrence in the last few years – four banks failed in both 2019 and 2020 – the size of the banks that failed is something we haven’t seen since 2008. The total combined assets of the three failed banks amounted to nearly $550 billion, which exceeds the total assets from the 25 bank failures in 2008 by nearly $170 billion according to the FDIC’s website. The initial instability in March was stabilized following timely acquisitions of SVB UK and Credit Suisse, in addition to the Fed stepping in to provide liquidity for depositors at the troubled institutions. However, the failure of First Republic Bank just last week shows that the turmoil facing the banking sector may not be so easy to dismiss. In response to the initial bank failures, Moody’s placed several banks on review for downgrade and on April 21st released a report on bank credit strength in conjunction with ratings actions to a long list of banks. Moody’s downgraded eleven banks (including all seven initially placed on review for downgrade), placed five on negative outlook, changed four from positive outlook to stable, and affirmed two ratings. While the banks on this list are primarily regional institutions, the risk factors highlighted by Moody’s signal that continued headwinds are likely to exist for the banking sector as a whole. In particular, Moody’s identified interest rate risk and asset liability management (ALM) as key ongoing concerns for the banking sector.
While the first quarter was not the smooth start to the year many had wished for, there are still opportunities for borrowers in the current market despite elevated interest rate levels. If you would like to evaluate options or discuss capital plans in the context of these market conditions, please reach out to your Blue Rose advisor to schedule some time to connect.
[1] See Wells Fargo Higher Education Weekly Market & Sector Update from April 18, 2023.
Comparable Issues Commentary
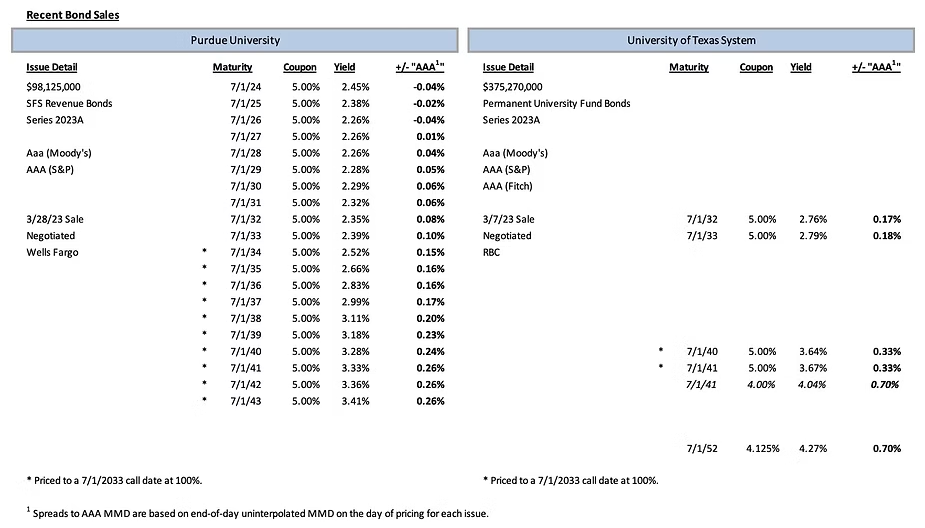
Shown below are the results of two highly-rated higher education financings that priced in March. On March 8th, the University of Texas System (“UT”) priced its tax-exempt Series 2023A Permanent University Fund Bonds. Three weeks later on March 28th, Purdue University (“Purdue”) priced its tax-exempt Series 2023A Student Facilities System Revenue Bonds. Purdue’s transaction was purely a refunding and served to refinance the university’s outstanding Series 2022B bonds. These bonds were originally issued as a bridge financing to fund the acquisition of the Aspire Housing Complex located on Purdue’s West Lafayette, IN campus. UT’s transaction was also a refunding issue, serving to refinance the System’s outstanding Series 2014A bonds along with a refinancing of outstanding commercial paper.
The bonds of both institutions carried “Aaa/AAA” ratings from Moody’s Investors Service (“Moody’s”) and S&P Global Ratings (“S&P”), respectively. UT’s bonds also carried a “AAA” rating from Fitch Ratings. Both transactions were sizeable, with Purdue’s total par at $98.125 million and UT issuing $375.27 million. Both deals are callable at par on July 1, 2033. The structuring of the two deals is the greatest point of contrast. Purdue’s Series 2023A was fully serialized from 2024-2043 while UT’s Series 2023A featured large, intermittent serial maturities (with each maturity exceeding $25M in size) in 2032-2033, 2040-2041, and 2052. Purdue’s bonds carried exclusively 5% coupons. UT’s transaction featured mainly 5% coupons as well, but it did utilize a bifurcated 4% coupon in 2041 (alongside a larger 5% coupon maturity in that year) as well as a 4.125% coupon on the 2052 maturity.
From the beginning of March leading up to UT’s pricing date (3/8), the MMD index was relatively unchanged. At the one-year tenor on the curve the benchmark fell by 5 bps, with the rest of the curve increasing by 2 bps in years 2-30. On the day of UT’s pricing, the MMD index dropped 2 bps in the first five years (2024-2028) but was otherwise entirely unchanged. UT’s issue ultimately achieved spreads of 17-33 bps on its 5% maturities and a spread of 70 bps on both its 4% and 4.125% maturities.
Over the ensuing three weeks, MMD fell 23-54 bps along the yield curve with the largest movements again coming in the first five years. On March 28th, Purdue’s pricing day, markets were relatively calm, with the only changes coming in the four to seven-year tenors, where the index decreased by 2 bps. Purdue ultimately achieved spreads ranging from 15-26 bps on its callable serial maturities. On the overlapping callable 5% coupon maturities between the two deals, Purdue priced 7-9 bps tighter than UT.

Interest Rates


Ben Pietrek | [email protected] | 952-746-6055
Ben Pietrek joined Blue Rose in 2021 and works as an Analyst. In his role Mr. Pietrek is responsible for providing analytical, research, and transactional support to the lead advisory team serving higher education, non-profit, and government clients with debt advisory, derivatives advisory, and reinvestment advisory services. He is also responsible for credit and debt capacity analyses.
Media Contact:
Megan Roth, Marketing Manager
952-746-6056


