Treasury Yield Responses to Federal Reserve Rate Cuts
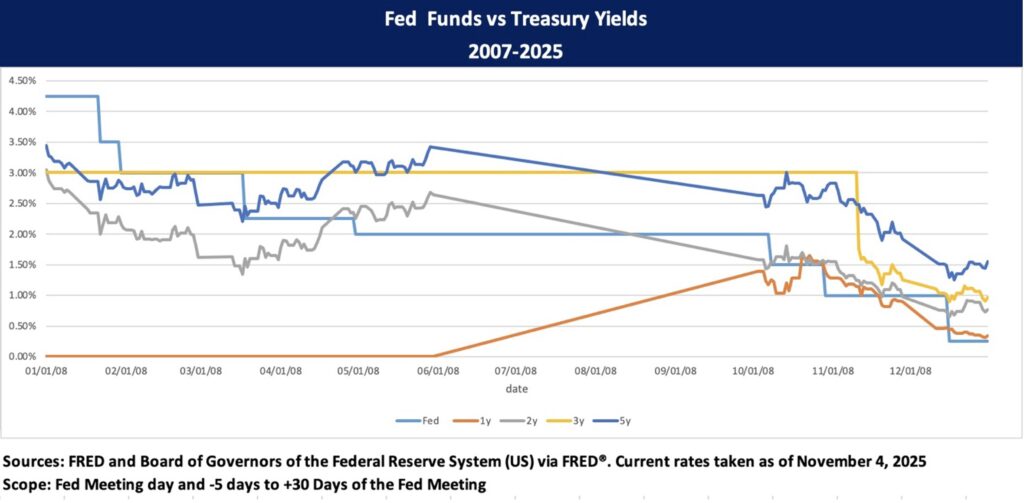
Given the focus on recent activity of the Federal Reserve (Fed) and expectations of one more Fed rate cuts over the next few months, many of our clients have asked us what that might mean for the interest rates that they might earn on their bond proceeds. Accordingly, we reviewed the behavior of the Treasury market over the past approximately 20 years to see if we could identify quantifiable patterns and relationships between Federal Reserve activity and US Treasury securities. While, for the most part, yields on Treasury securities generally followed the direction of Fed actions as shown in the chart above, this wasn’t always the case and at times they moved in opposite directions. In our analysis, we explored Treasury yields for two-, three- and five-year maturities for the time just before Fed action (where markets reacted to expectations of cuts or hikes by the Fed as well as the period up to one month after Fed action. The adage of “buy the rumor, sell the news” seems to be in play here and in short, we were unable to identify any meaningful direct correlation. Below, we summarize the results of our analysis.
Key Findings
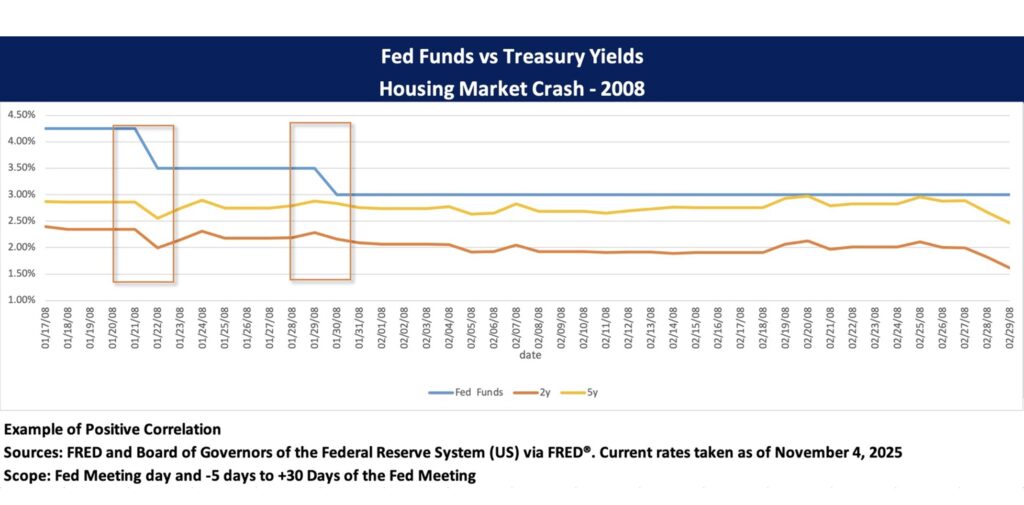
1. Housing Market Crash and Sub-Prime Crisis (2007–2008)
- During this time period, the Fed aggressively cut rates from 4.75% to 0.25% to combat the financial crisis, with early cuts showing mixed market responses with positive correlations in September and December 2007, but negative or muted reactions by October 2007.
- From January to March 2008, Treasury yields were strongly influenced by rate cuts, with a 75-bps cut translating into a 30–35 bps decline in 2- and 5-year Treasury yields, demonstrating increasing market sensitivity to Fed actions.
- By October 2008, the market began to anticipate Fed moves, with yields adjusting before official announcements, reflecting rapid information absorption in the short end of the yield curve while longer maturities showed inflation and funding risk concerns. As the chart below shows, during this time period, Treasury yields strongly correlated with the Fed Funds rate.
2. Return to Normalcy (2015–2019)
- After years of near-zero rates, the Fed embarked on a gradual rate hike cycle from late 2015 to 2019, moving rates from 0.25% to 2.50%. Early hikes, like those in December 2015 and March 2017, produced moderate positive correlations, indicating that markets largely priced in these changes well in advance.
- Over time, yield responses diminished by late 2018, markets showed minimal reaction, signaling that rate hikes were fully anticipated, and the yield curve began to flatten, reflecting concerns about economic growth and the potential peak of tightening.
- Market behavior during this period underscores a mature relationship where policy adjustments were incorporated into forward rates, reducing volatility and signaling investor confidence in Fed communication.
3. Mid-Cycle Adjustments and Covid Overlap (2019–2020)
- The Fed’s mid-cycle easing in 2019 triggered strong positive correlations in Treasury yields, especially during rate cuts in July and August. However, a brief yield reversal in September indicated market uncertainty about the continuity of easing.
- In the early stages of the Covid pandemic (March 2020), rapid back-to-back emergency rate cuts drove sharp declines in short-term yields, while longer maturities showed more measured adjustments, highlighting market differentiation between immediate policy impact and longer-term outlook.
- These episodes demonstrated the market’s increasing role in anticipating Fed policy, reacting dynamically to economic shocks while interpreting signals on future growth and inflation.
4. Taming Inflation (2022–2025)
- As the chart above shows, aggressive post-pandemic rate hikes from 0.50% to 5.50% saw an initially strong and positive correlation with Treasury yields, as markets factored in tightening, evident during hikes in early and mid-2022.
- By late 2022 and into 2023, longer-term yields began showing negative correlations, reflecting expectations of slowing growth amid persistent inflation, while short-term yields remained highly reactive to Fed decisions.
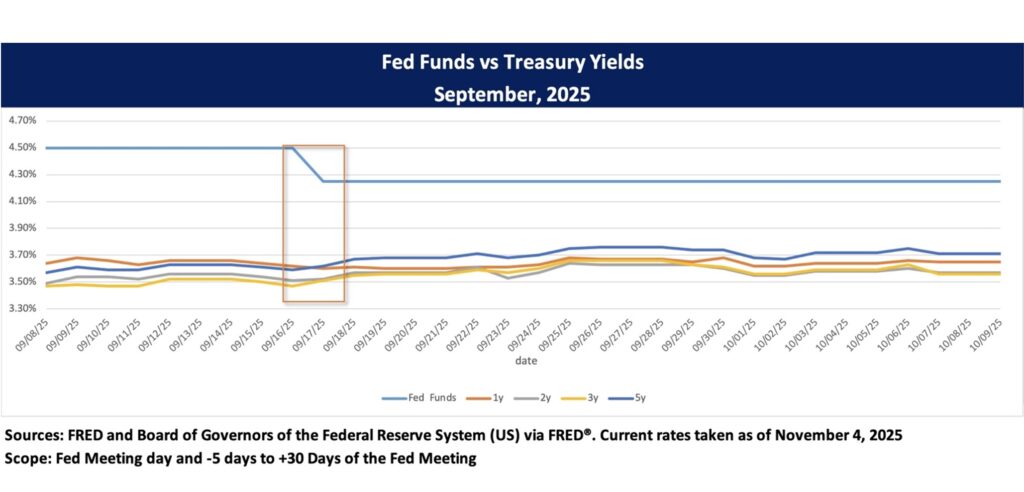
- From 2024 onward, the market increasingly priced in pauses and eventual cuts well before Fed meetings, with shorter maturities showing the strongest responses, signaling a sophisticated market that balances current policy with forward inflation and growth expectations. The immediate reaction to the September 2025 cut was negatively correlated, as we saw the market stabilizing itself in the coming weeks.
Conclusion
- Across cycles, short-term Treasury yields (1Y, 2Y) consistently exhibit the strongest immediate correlation with Fed rate changes, while longer maturities (3Y, 5Y) reflect delayed or inverse reactions during prolonged tightening or easing.
- The dominance of “priced in” behavior reflects a market that actively anticipates policy moves, minimizing surprises and promoting financial stability.
- This evolution from 2007 to 2025 illustrates a dynamic monetary transmission mechanism, where market pricing complements Fed policy, enhancing overall economic resilience.
We’re Presenting!
Maxwell Wilkinson, Vice President, is presenting on a live webinar with CliftonLarsonAllen on December 17, 2025. Join our complimentary webinar, Managing Debt Covenants and Financial Ratios in a Challenging Environment, to explore how financial covenants and ratios shape operational planning and debt management in higher education. At the end of the session, you will be able to:
- Identify key strategies for structuring and management of financial covenants for loans and debt obligations
- Recall the ramifications of missing a financial covenant and potential solutions or remedies
- Recognize the impact of debt financing on the financial responsibility composite score and identify recommended practices for planning new debt financing initiatives
Register here today!
CLA will provide CPE credit for the webinar, Managing Debt Covenants and Financial Ratios in a Challenging Environment – December 17. See event page for details and CPE information. Recorded webinars are not eligible for CPE.
Sam Gruer | [email protected] | 973-761-1741
Sam Gruer brings more than 30 years of capital market experience to his role as Managing Director at Blue Rose Capital Advisors, where he focuses on the firm’s business development efforts and providing senior advisory services. Mr. Gruer guides clients through the debt/swap/reinvestment transaction process by making strategic recommendations based on sound, thoughtful, and sophisticated analysis. During his career, Mr. Gruer has advised on and/or executed bond, derivative, and reinvest transactions totaling more than $50 billion for tax-exempt borrowers and financial institutions. He also offers expert advice on determining the optimal structure for reinvestment of bond proceeds by evaluating risk tolerance, identifying legal restrictions, and estimating cash flow needs for his clients. This expertise comes from serving as a structurer, trader, and marketer of interest rate derivatives and defeasance products at some of the largest banks and broker/dealers. He serves clients from our New York regional office.
In his latest role at Mesirow, Mr. Gruer specialized in serving Northeast and Southeast clients who issue general obligation and revenue-backed bonds and served as co-head of Mesirow’s Defeasance Solutions group. In 2008, Mr. Gruer co-founded Cityview Capital Solutions, serving as Managing Director and providing debt, swap, asset/liability management, and reinvestment advisory services to municipal and not-for-profit borrowers. His prior experience also includes leadership roles at Deutsche Bank as Director of Derivative Structuring, at JPMorgan Chase as co-founder of the municipal derivatives department, and at Prudential Securities as Head of New Products for the municipal securities division. Earlier in his career, he worked in municipal finance at Goldman Sachs and Morgan Stanley
Media Contact:
Laura Klingelhutz, Marketing Coordinator
952-208-5710