top of page
Max Wilkinson

FAFSA Delays and SIFMA Index Volatility Among Key Market Considerations to Open 2024

Minneapolis, MN | March 14, 2024 | Maxwell Wilkinson, Vice President


As FAFSA Challenges Persist, Colleges and Universities Scramble to Adjust


By now, colleges and universities are quite familiar with the unique challenges that changes to the FAFSA (Free Application for Federal Student Aid) pose to financial aid offices for 2024-25. Typically available to prospective students beginning in October, the Department of Education delayed the new FAFSA rollout until late December for this admission cycle.  Even after this delay, many families were unable to fully access the form for weeks thereafter, and a myriad of glitches, data issues, and other issues persisted even after the new form’s unveiling. Only this week has the Department of Education finally been able to begin sending initial student information to some colleges and universities, with considerable work remaining to provide schools all the data they need for packaging financial aid offers for incoming students (typically, this data is provided by the government months earlier).


While colleges and universities are scrambling to adjust deadlines and preparing to quickly turn around financial aid packages, the credit rating agencies remain extremely cognizant of the potential negative credit impact of these delays, particularly for those institutions most in need of clarity and stability on the enrollment front. Highly selective institutions face far less risk of a materially negative impact to their enrollment numbers, but for colleges and universities facing more competition, particularly small private institutions with limited tolerance for volatility in class sizes, the ultimate impact of the FAFSA delay is far from certain. Additionally, schools serving a higher percentage of students from lower- and moderate-income families face the added risk that the increased complexity and repeated delays of this year’s aid process may discourage those students from attending college entirely. Such an outcome could have negative ripple effects for years to come for these institutions. All these factors will add new challenges to the FY 2025 budgeting process, with the potential for late adjustments to be required if enrollment actuals do not match expectations.


Ultimately, colleges and universities will undoubtedly make every effort to navigate the unique aspects of the financial aid process for the 2024-25 academic year. However, regardless of their diligence, the risks presented by the FAFSA delays are impossible to completely eliminate for many schools. As a result, it will be crucial for institutions to be both conservative and nimble as they plan for the coming fiscal year to mitigate the possibility of large, unexpected swings in enrollment or financial aid expenses.


Shrinking VRDB Market and High Short-Term Rates Drive Substantial Swings in SIFMA Resets
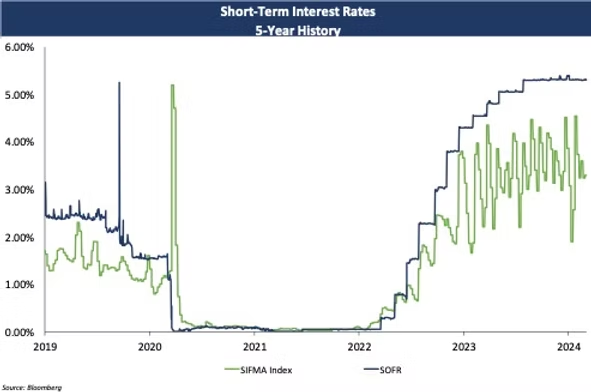

In late 2022 and early 2023, as the Fed began sharply hiking short-term interest rates to address persistent inflation in the U.S. economy, the SIFMA index (a proxy for tax-exempt variable rate demand bond resets) started to increase in concert with the Fed Funds rate, though with some dips along the way in between interest rate hikes. Through the rest of 2023 and continuing into 2024, however, the index has experienced severe and persistent volatility unlike anything seen in recent memory. For context, in 2023, the average change in SIFMA with each weekly reset (on an absolute value basis) was 61 bps. In 2024, that average weekly change has increased further to 68 bps. In comparison, the average weekly change from 2019-2022 was just 12 bps, a substantial differential even when factoring in the near-zero variable rates that prevailed in the post-COVID environment from mid-2020 to early 2022 (in 2019, when SIFMA averaged approximately 1.50%, the average weekly reset change was also just 12 bps). Furthermore, the magnitude of weekly changes has increased dramatically as well over the past 15 months. Excluding the tempestuous four-week period from mid-March to mid-April 2020 at the onset of the COVID pandemic in the U.S., from January 2019 to December 2022 the largest single-week shift in the SIFMA index was 68 bps, and the index moved by 50+ bps week-to-week on only five occasions. Since then, the index has moved by as much as 198 bps in a week (in January of this year), with ten instances of 100+ bps moves week-to-week and over 30 weekly moves in excess of 50 bps. The graph below tracks the SIFMA index’s resets over the past five years in comparison to the SOFR index over the same time period.


Short-term interest rate graph

The obvious question is this: what is causing such profound change, and is it likely to continue through the remainder of 2024 or even beyond? There are several reasons for this phenomenon, but a key driver has been the impact of reduced tax-exempt money market fund assets, with 2023 showing consistent outflows for many mutual funds that use VRDBs as a vehicle for maintaining liquidity. This lower demand for VRDB investment also resulted in large part due to the increased variety of alternative high-yielding short-term assets such as high-yield savings accounts and short-term Treasuries, both driven by the Fed’s increases to interest rates. These factors have combined with the limited supply of new VRDB issuance and the inconsistent nature and timing of investor demand to create the dramatic ebbs and flows in SIFMA rates in recent months.


Notably, despite this volatility, the average SIFMA/SOFR ratio has remained attractive in 2024 at just over 61%, meaning that the all-in cost of capital over the year for borrowers utilizing VRDBs has been favorable on a relative basis. By comparison, the average SIFMA/SOFR ratio was slightly above 66% in 2023 and upwards of 85% from March 2022 (after the Fed first began its current rate hiking cycle) through December of that year. As such, borrowers willing to accept some added unpredictability in reset rates on a week-to-week basis have benefited from borrowing rates that, on a relative basis, are potentially lower than they might have otherwise obtained using alternative variable rate modes of issuance such as SOFR-based loans. On the other hand, this unpredictability also adds to the risk of SIFMA remaining consistently elevated should market factors or demand changes drive rates higher without a corresponding move from the Fed. Current market expectations are for the Fed to begin reducing interest rates at some point later in 2024, and such a move could begin to mitigate the current volatility of the SIFMA market as the yield curve begins to normalize and the attractiveness of alternative short-term investments starts to be diluted. Nevertheless, borrowers with exposure to VRDBs will want to continue to monitor their reset rates in the interim to ensure that they remain manageable while this uncertain paradigm persists. If you have outstanding VRDBs or are considering issuing them in the future, we encourage you to reach out to your Blue Rose advisor to carefully evaluate the pros and cons of this financing product as well as those of other variable rate alternatives.


Blue Rose Capital Advisors Erik Kelly, President, and Brandon Lippold, Vice President, will present at the Wisconsin Health and Educational Facilities Authority (WHEFA) Lunch & Learn Webinar on March 26, 2024. Erik and Brandon plan to share their insights and perspectives on:


  • Year-to-date 2024 market activity

  • Industry prognostications on expected Fed rate setting activity

  • Historical market performance in declining rate environments

  • Interpreting the 'noise' during an election year


They will also address prevailing capital planning strategies to consider, such as:


  • Refunding opportunities

  • Reinvestment opportunities

  • Strategies to address the inverted yield curve

  • Pricing dynamics and the utilization of interest rate swaps


Interested in attending? Sign up here: https://whefa.com/resources/whefa-workshop/


Comparable Issues Commentary
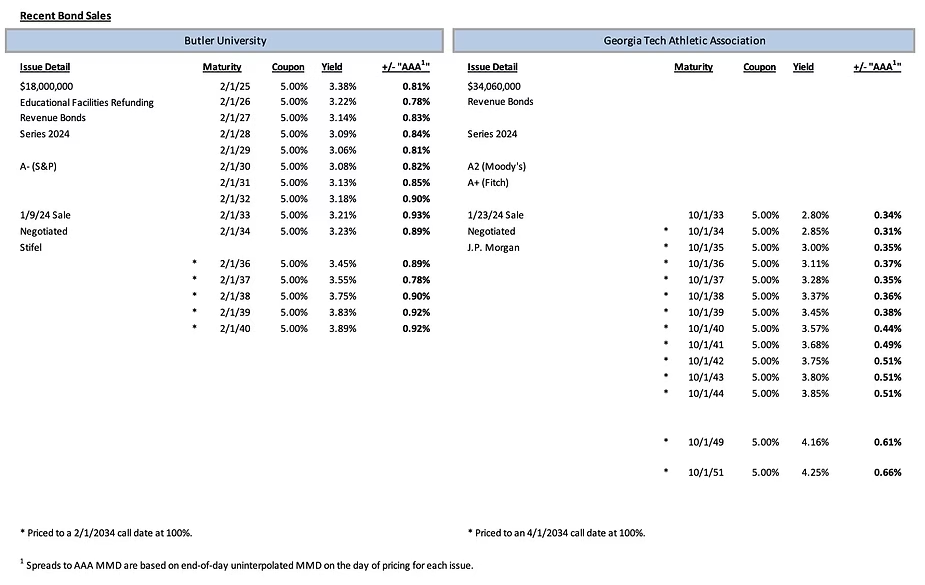

Shown below are the results of two higher education financings that priced in January. On January 9th, Butler University (“Butler”) priced its tax-exempt Series 2024 Revenue Bonds. Roughly two weeks later, on January 25th, the Georgia Tech Athletic Association (“GTAA”) priced its tax-exempt Series 2024 Revenue Bonds. Butler’s transaction was purely a refunding, which served to refinance the University’s outstanding Series 2014A Bonds. GTAA’s deal, on the other hand, was purely a new money issuance and served to finance a new student athlete performance center.


These deals were both rated in the “A” category, with Butler rated A- from S&P Global Ratings and GTAA rated A2 by Moody’s Investor’s Service and A+ by Fitch. Despite similar ratings, these institutions are quite different. Butler is a moderate-sized private university located in Indiana, while the Georgia Tech Athletic Association is a component unit of Georgia Institute of Technology, a large public institution located in Atlanta. GTAA had the larger of the two deals, coming in at just over $34 million of total par amount, while Butler’s deal was just over half that size at $18 million. Both transactions featured a standard 10-year par call option.  The structures of the deals were relatively similar, although each had maturities concentrated on different tenors along the curve. Butler’s deal featured serial bonds in 2025-2034 and 2037-2040 with a lone term bond in 2036. GTAA, on the other hand, had twelve years of serial maturities from 2033-2044 followed by two term bonds in 2049 and 2051. Both transactions used 5% coupons exclusively.


Butler was among the first higher education transactions to price in 2024. From the end of 2023 through January 8th -  the day before Butler’s pricing -  MMD had declined slightly at the 2-year and 5-year points on the curve but was otherwise up 1-10 bps along most of the yield curve. On pricing day, MMD increased by 4-10 bps in tenors 1-3. Despite these headwinds, Butler was ultimately able to achieve spreads of 78-93 bps on its serial bonds and a spread of 89 bps on its term bond. Rates moved higher over the next several weeks leading up to GTAA’s pricing. Between January 9th and January 22, MMD increased by 14-20 bps across the curve. On GTAA’s pricing day, MMD rose by 2 bps on the 11–30-year tenors. GTAA was ultimately able to achieve spreads of 31-51 bps on its serial maturities and 61 and 66 bps on its two term bonds.


Recent Bond Sales spread


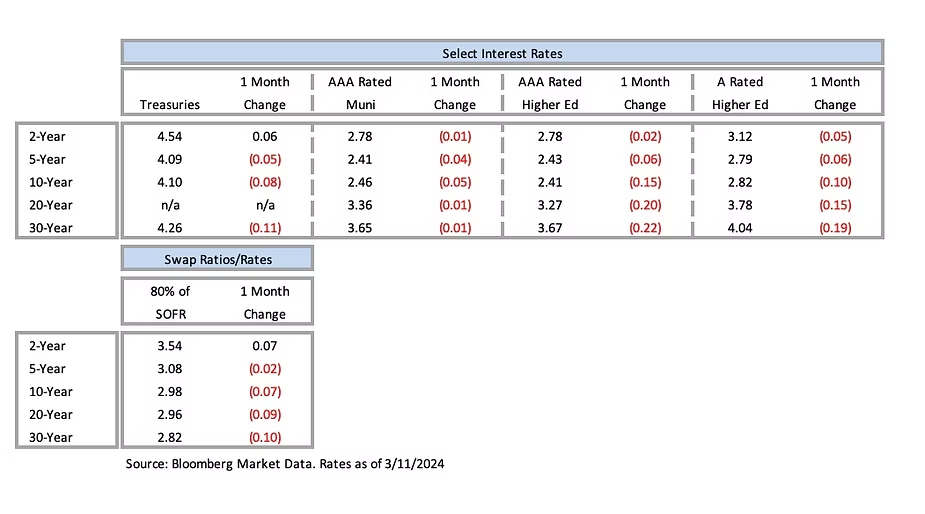
Interest Rates

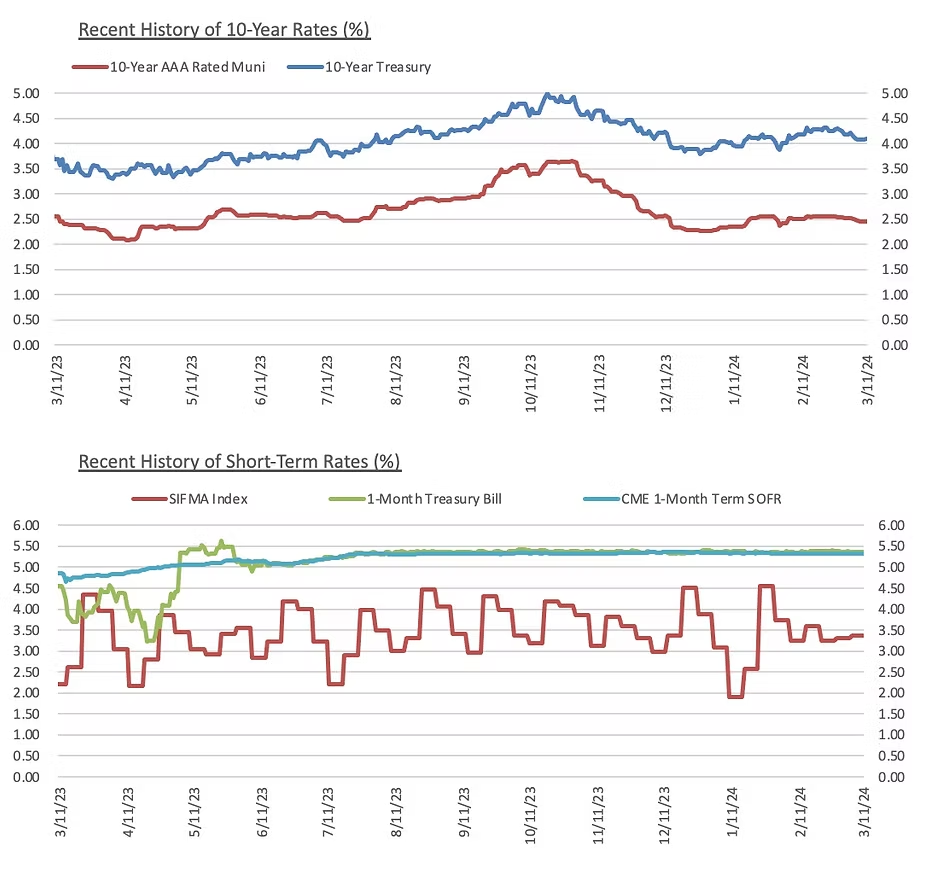
March Interest Rate Charts

March history of interest rates graphs
 

Meet the Author:


In his role of Vice President, Max Wilkinson manages a number of the firm’s clients, ensuring that their transactions progress smoothly and effectively throughout the financing process. He has significant expertise in the preparation of credit and debt capacity analyses and is experienced with the pricing and execution of fixed rate bond transactions, direct purchase bonds, and derivative and reinvestment products. Mr. Wilkinson is closely involved in every step of the financing process for clients, from initial capital planning stages all the way through closing. He joined Blue Rose Capital Advisors in 2016.


Media Contact:


Laura Klingelhutz, Marketing Coordinator

952-208-5710


Recent Posts

See All

Comments


bottom of page