By: Adrienne Booker
Growing Credit Gap
Key Median Observations – Public Institutions
Enrollment Declines Despite Growth in Higher Rated Categories: For FY2018, S&P reported a modest 1% decrease in full time equivalent (FTE) median enrollment. However, FTE enrollment increased for ‘AAA’, ‘AA’ and ‘A’ rated public institutions. This is due largely to brand recognition, diverse programing and financial flexibility to address facility updates. Conversely, peer institutions rated in the ‘BBB’ category declined 2.7% due to weaker financial and demand fundamentals. Moody’s reported similar results for its rated public institutions with a modest decline in FTE median enrollment. Even so, medians for the ‘Aaa’ and ‘Aa’ categories increased, compared to declines at the ‘A’ and ‘Baa’ rating levels. While Fitch does not specifically provide FTE enrollment medians in its FY2018 report, the agency states that “enrollment challenges were a noted rating factor in the great majority of Fitch’s downgrades.”
Key Median Observations – Private Institutions
Enrollment Growth Despite Sector Challenges: For FY2018, S&P reported modest FTE enrollment increases across all rating categories despite enrollment pressures on small, regional institutions and entities facing heightened competition. According to S&P, the enrollment increases may be attributable to expanded efforts to counter undergraduate enrollment challenges with new programs for graduate and professional students or other strategies to accelerate student recruitment and retention efforts. The growth in graduate programs is supported by relatively flat or declining results when observing S&P’s medians for undergraduates as a percent of total enrollment. The likely increase in private institution enrollment, specifically on the lower end of the rating scale may be due to more competitive financial aid packages and increased tuition discounting as a strategy to attract more students. Moody’s median report reflects an increase in all rating categories with the exception of the ‘Baa’ category, where there is nearly a 1% decline in FTE enrollment.
Operating Performance Underscores Sector Challenges: S&P’s median report shows an overall decline in financial operations, which underscores the challenges that many private institutions are facing; this is coupled with the sector’s heavy dependence on student-generated revenue. For FY2018, the median net adjusted operating margin dropped to 0.8% from 1.3% in the prior fiscal year. Institutions at the ‘AAA’, ‘AA’ and ‘A’ levels exhibited flat or slightly increased operating margin growth. However, the ‘BBB’ and non-investment grade categories showed weaker median net adjusted operating margins at -0.6% and -2.2%, respectively. Moody’s median report reflects similar overall results with an FY2018 median operating margin at 3.3%, a decrease from 4% in the prior fiscal year. Unlike S&P’s medians, Moody’s category-specific operating margins show slight to moderate declines at the ‘Aaa’, ‘Aa’ and ‘A’ levels for FY2018 in addition to a significant decline in the ‘Baa’ rated category.
Similar to S&P, Fitch’s operating performance ratios reflect the widening between higher rated and lower rated private institutions. Fitch’s adjusted operating margin, which includes endowment draw, decreased to 2% in FY2018 from a moderate 2.7% in the prior fiscal year. While the median for the ‘AAA’ rating category increased to 5.3% for FY2018, the ‘AA’ category median slightly declined to 2.4% from 2.7% in FY2017. Conversely, the median adjusted operating margins for ‘Baa’ and noninvestment grade categories are weaker at 1.8% and -1.2%, respectively.
FY2018 Median Results Support Sector Outlook
The S&P, Moody’s and Fitch FY2018 median reports highlight the widening credit gap between higher rated and lower rated (‘BBB’ category and below) institutions. The median results also support the sector’s credit outlook for the 2019 calendar year. S&P and Moody’s each maintained their negative outlooks on the sector from the previous year, while Fitch revised its sector outlook for 2019 to negative from stable.2 Although the stated bases for the negative outlooks vary, operating/net tuition revenue pressures and growing expenses are consistent themes among the rating agencies. While it may appear that financial challenges within the private college and university sector are more severe, it is important that both public and private institutions, especially those that are at the lower end of the rating spectrum, implement creative and adaptable strategies to stabilize their financial and operating positions in order to remain successful.
1 The information in this article is based on the following median reports published by S&P, Moody’s and Fitch:
“U.S. Public College and University Fiscal 2018 Median Ratios: The Disparity Between Higher- And Lower-Rated Entities Persists,” published June 25, 2019 by S&P.“U.S. Not-For-Profit Private Universities Fiscal 2018 Median Ratios: Overall Stability Continues Despite Lingering Issues,” published June 25, 2019 by S&P.“Higher Education – US Medians – Public University Revenue Growth Declines Again, Driving cost Containment,” published June 27, 2019 by Moody’s.“Higher Education – US Medians – Private Universities’ Low Revenue Growth Tightens Operating Performance,” published June 27, 2019 by Moody’s “Fiscal 2018 Median Ratios for U.S. Colleges and Universities,” published July 12, 2019 by Fitch.
2 For additional information regarding rating agencies’ 2019 outlook for the higher education sector, see the following research:
“Global Not-For-Profit Higher Education 2019 Sector Outlook: Credit Pressures Proliferate,” published January 24, 2019 by S&P. “Higher Education – US – 2019 Outlook Remains Negative With Continued Low Net Tuition Revenue Growth,” published December 4, 2018 by Moody’s.“Fitch Ratings 2019 Outlook: U.S. Public Finance Colleges and Universities,” published December 6, 2018 by Fitch.
Comparable Issues Commentary
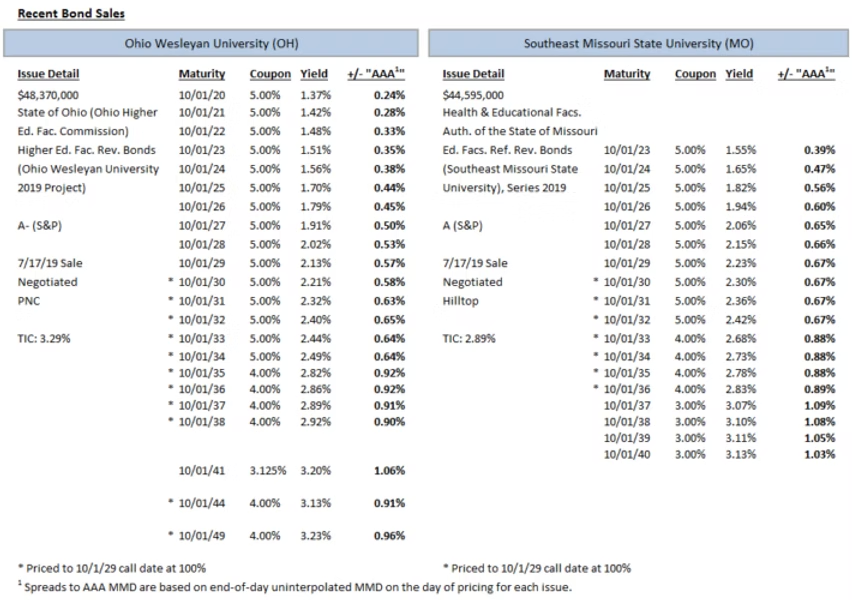
Ohio Wesleyan’s issue was structured with a 30-year final maturity in 2049, while Southeast Missouri State’s bonds carried a shorter final maturity in 2040, possibly due to the lack of a new money component. Structurally, the two deals were extremely similar in most respects, with primarily level debt service payments, serialized bond structures through the first 20 years of the curve (Ohio Wesleyan did, however, utilize 3 term bonds after the 20-year point in 2041, 2044, and 2049), and matching 10-year par call options. Even the coupon structures of the two deals were relatively paralleled, with both Universities using 5% coupons on earlier maturities before graduating to lower 4% and 3% coupons later down the curve, although Ohio Wesleyan utilized 5% coupons for more maturities (from 2020 through 2034 compared to Southeast Missouri State’s 5% coupons from 2023-2032). Ohio Wesleyan’s 5% callable maturities priced at spreads ranging from +58 to +65 bps above AAA MMD, with its 4% maturities ranging from +90 bps to +96 bps. Southeast Missouri State’s callable 5% coupon bonds priced at spreads of +67 bps to MMD, while its 4% coupons were sold at spreads of +88-89 bps.

Interest Rates


