top of page
Ben Pietrek

The Shield - July Market Update

Minneapolis, MN | July 31, 2024 | Benjamin Pietrek, Associate


In our previous market update published in mid-May, we focused on interest rate volatility and signaling from the Fed on its rate outlook for the remainder of the year. While rate volatility has somewhat calmed, the interest rate environment is still elevated relative to the last several years. As volatility has cooled, speculation around Fed rate cuts has heated up due to recent positive reads on inflation and unemployment. Additionally, there is considerable uncertainty around how markets will react to the upcoming election. Below are several market developments that we at Blue Rose have observed in the markets through the first half of 2024.


Interest Rate Movements and Impact


Since May 15th, tax-exempt and taxable rates have generally trended lower, although both indexes have seen upticks in certain parts of the curve. MMD declined by 33, 22, and 12 bps, respectively on 1-year to 3-year tenors. Tenors in the 4-year to 12-year range saw modest increases of 1-8 bps and at the 13-year tenor and beyond, the index moved lower by 4-9 bps. While the yield curve is still inverted, the inversion at the front end of the curve is shallower now than it was on May 15. The 1-5 year spread on MMD has declined from 47 bps to 11 bps in that time. Treasury rates exhibited similar characteristics, as rates fell 23-36 bps on tenors between one and five years. The 7- and 10-year tenors exhibited drops of 15 bps and 8 bps, respectively. The 20-year and 30-year rate increased by 1-2 bps.


While rates have been drifting lower overall, issuance has been accelerating across most rating categories in the higher education sector, particularly on the lower end of the credit spectrum. In mid April, nearly 84% of the issuance for the year was attributable to the AAA- and AA-rating categories. As of early July, those transactions now make up around 79% of the ~$19.75 billion in higher education and nonprofit issues so far in 2024. The pickup has been most notable in the BBB and below rating space. As of our last market update, issuance from this group was only 4%, almost all of which came from BBB-rated institutions. That figure now sits at just over 7%. While the bulk of it is still BBB credits, issuance in the BB-rating category has gone from roughly $40 million in April to nearly $200 million as of earlier this month. Nonrated transactions in the sector have started to issue and now account for $120 million of supply, up from zero in our last update.


Economic Developments


The Federal Reserve’s fight against inflation and its impact on markets and the broader economy remain key issues. In recent weeks, we have seen encouraging data suggesting that inflation is finally falling back toward the Fed’s long-term 2% target. In June, the core personal consumption expenditures price index, the Fed’s preferred inflation gauge, increased 0.2% and was up 2.6% from a year ago. A jobs report released earlier this month showed unemployment rising to 4.1%, slightly higher than the 4% target set by the Fed. Debt and equity markets have been reacting favorably to the news. According to the CME Group, as of July 30 there is now a 100% probability of a rate cut on or before the September 18th meeting. 85.8% of respondents believe there will be a 25 bps cut, while just under 14% of respondents believe it will be a 50 bps cut. Many of those respondents think further cuts will be in store before the end of the year. As of July 30, ~57% of those surveyed believe the fed funds rate will be in the 450-475 bps range following the December 18 meeting.


As we move further into the second half of 2024, we are cautiously optimistic that these favorable trends will continue. If the market’s expectations of the Fed hold true, rates could ease further as the summer and fall progress. We expect to see some volatility in the markets around the election in November, which is not unusual. A change in presidential candidates a few months before the election introduces another layer of uncertainty around how markets will react to the new administration. If inflation and unemployment data continue to move in the right direction, however, this volatility may be short-lived. If you have questions or would like to discuss capital plans in the context of these market conditions, please schedule some time to connect with your Blue Rose Advisor.


Comparable Issues Commentary


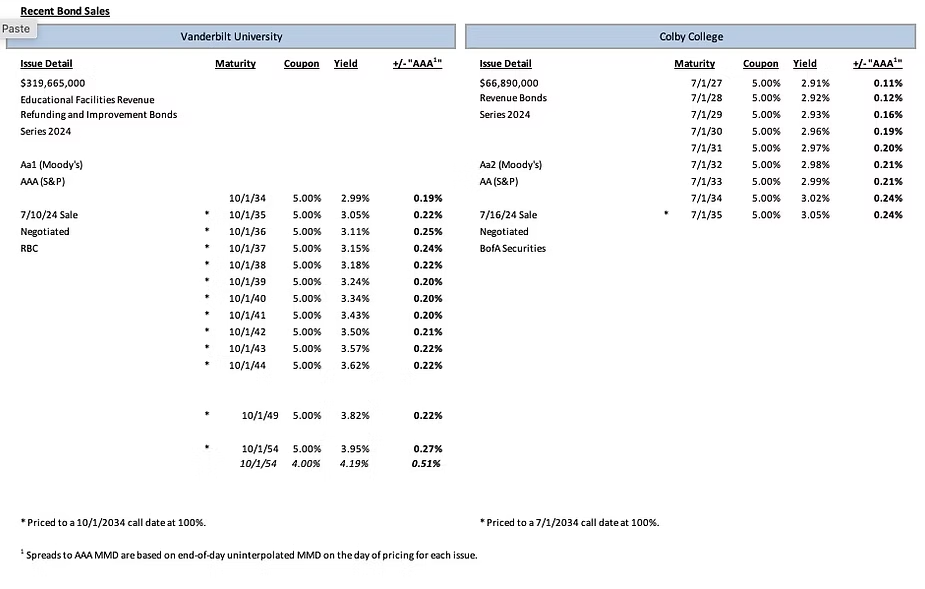
Shown below are two transactions in the high grade / prime rating categories that priced in the month of July. On July 10th, Vanderbilt University (“Vanderbilt”) priced its tax-exempt Series 2024 Educational Facilities Revenue Refunding and Improvement Bonds. Less than a week later, on July 16th, Colby College (“Colby”) priced its tax-exempt Series 2024 Revenue Bonds. Vanderbilt’s issuance was a multi-purpose issue which refunded $75 million of outstanding commercial paper and financed a variety of new money projects on its campus in Nashville. Colby’s bonds were issued solely to finance a new residence hall on its campus in Maine. Both universities’ transactions were negotiated issues.


Vanderbilt’s bonds carried a Aa1 from Moody’s and a AAA rating from S&P Global Ratings, while Colby’s bonds were rated lower at Aa2 and AA from the two agencies, respectively. Vanderbilt’s transaction was the larger of the two, coming it around $319.7 million. Colby’s was just under $67 million in total par amount. Both schools’ bonds feature a standard 10-year call provision in 2034. The structures of the two deals were slightly different: Vanderbilt’s transaction was serialized from 2034-2044 and featured a 2049 term bond as well as a bifurcated 2054 term bond. Colby’s issuance was fully serialized from 2027-2035. All maturities across both transactions used 5% coupons, except for one of Vanderbilt’s 2054 term bonds, which featured a 4% coupon.


From the beginning of July up to Vanderbilt’s pricing, rates increased on the front end of the curve. The 1, 2, and 3-year tenors saw an uptick of 11, 9, and 7 bps, respectively. Other tenors inside of 8 years saw more modest increases of 1-4 bps. Most tenors beyond 8 years largely saw slight decreases of 1-2 bps, although some remained unchanged. On Vanderbilt’s pricing date the 1 and 2-year tenors decreased by 4 bps and all others were unchanged. Vanderbilt was ultimately able to achieve spreads of 19-27 bps on its maturities with 5% coupons and a spread of 51 bps on the lone 4% term bond. Over the next five days, rates moved lower by 5-8 bps across the curve. On Colby’s pricing date rates fell again by 2 bps across the curve. Colby was ultimately able to achieve spreads of 11-24 bps on its serial maturities.


Recent bond sales for Vanderbilt University and Colby College


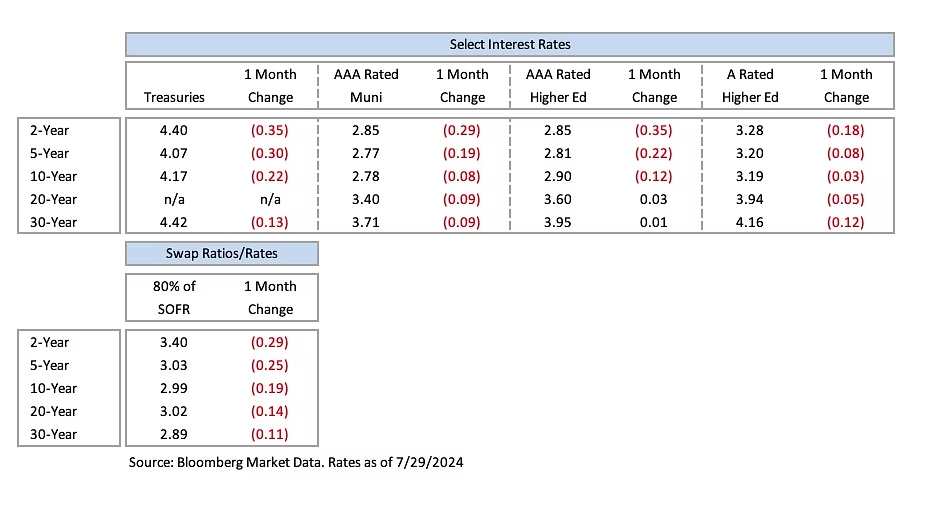
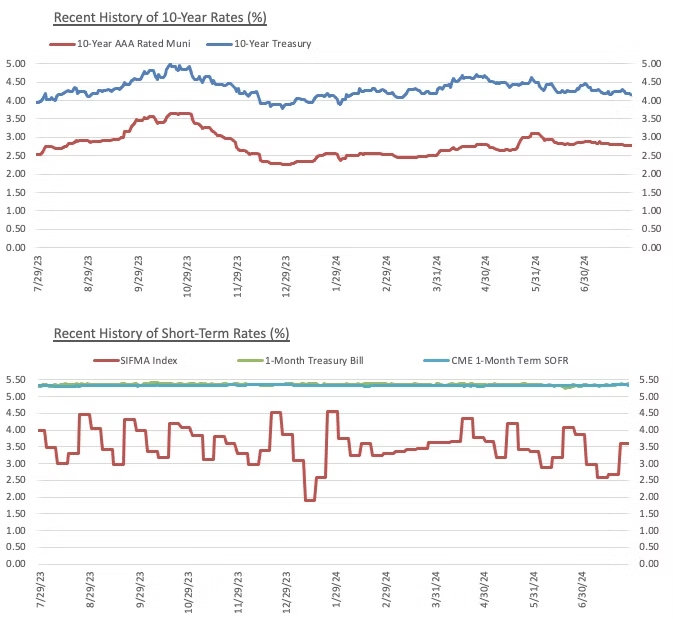
Interest Rates

Interest rates table based on July 29, 2024
Interest rates chart based on July 29. 2024


Meet the Author:


In his role of Associate, Ben Pietrek provides analytical and research support to the lead advisory team for Blue Rose’s debt, derivative, and reinvestment transactions for higher education, non-profit, and government clients. He is also responsible for executing pricing opinions and credit and debt capacity analyses.

Prior to Blue Rose, Mr. Pietrek worked for Altra Federal Credit Union where he drafted and filed various mortgage-related legal documents, along with preparing quarterly reports for management and assisted in creating annual reports for FHLB auditors. He has also held internships with Rockaway Capital and the Idea Fund of La Crosse where he assisted with various financial and analytical projects. Mr. Pietrek joined Blue Rose in 2021 as an Analyst.


Media Contact:


Laura Klingelhutz, Marketing Coordinator

952-208-5710


11 views0 comments

Recent Posts

See All

Comments


bottom of page