top of page
Ben Pietrek

The Shield - May Market Update

Minneapolis, MN | May 15, 2024 | Benjamin Pietrek, Associate


Markets have remained volatile through the first four months of 2024, continuing a theme that we observed at the end of last year. Rates have moved significantly higher and equity indexes sit near all-time highs. However, there is significant uncertainty around how the rest of the year will unfold.  Much of that story will be determined by the actions of the Federal Reserve this year as it continues to battle high post-pandemic inflation levels. Below are several market developments that we at Blue Rose have observed in the markets through the first four months of 2024.


Interest Rate Movements and Impact


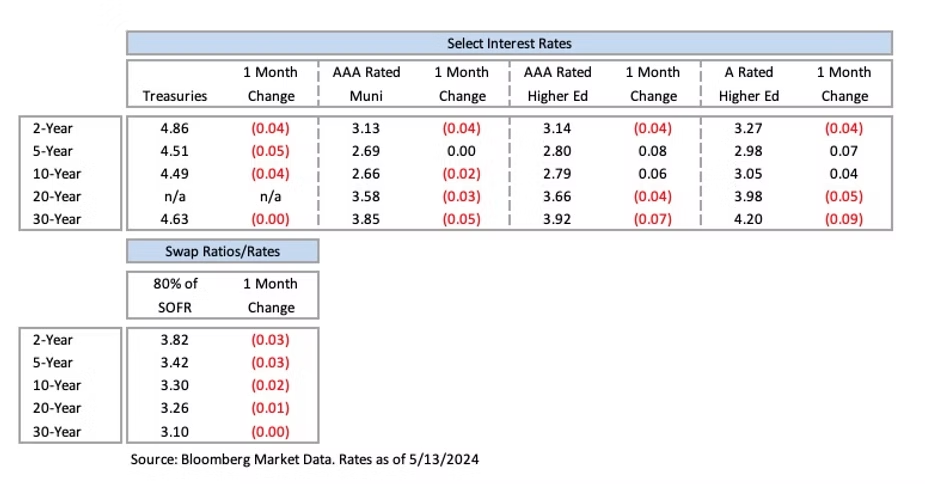
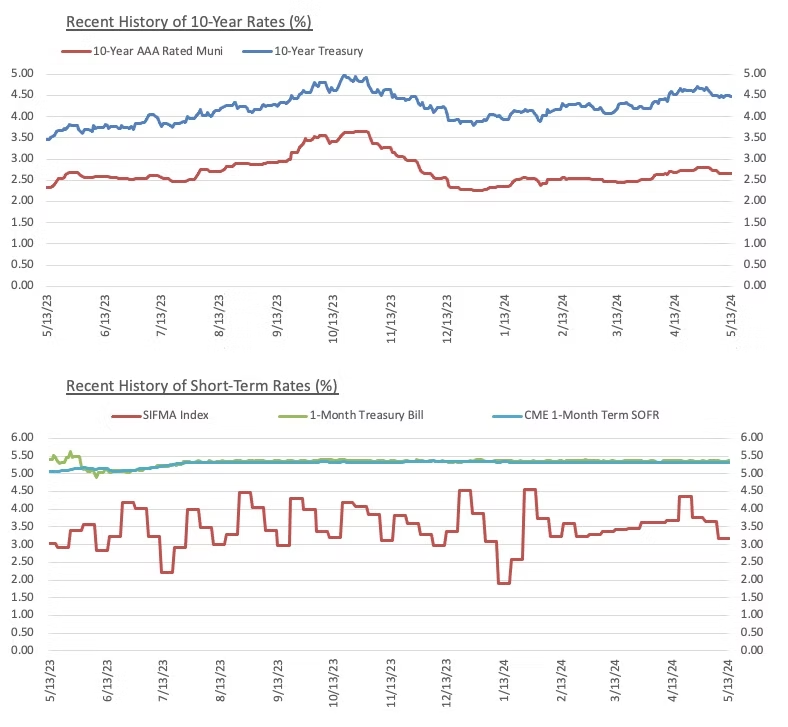
Interest rate volatility has been a headline for much of the year, as taxable and tax-exempt rates have reversed the downward trend near the end of 2023, trending back upwards. Since the beginning of the year to May 13th, MMD has risen between 33-56 basis points (“bps”) across the curve while treasuries have seen a similar uptick of 37-66 bps. While rates remain comfortably off the mid-October highs of last year, the volatility isn’t impacting issuance volume in the higher education and non-profit sectors. According to data from Thompson Reuters and Bloomberg, through April 19th tax-exempt issuance for the year was around $11.6 billion compared to $5.1 billion at the same time last year. Taxable issuance was around $1.6 billion for the same period compared to just $440 million last year. For reference, at the same point in 2022 tax-exempt issuance was around $5.5 billion and taxable issuance was nearly $9 billion. Despite the increase in issuance, it seems issuers on the lower end of the credit spectrum have opted to stay on the sidelines. Of the roughly $13.2 billion of total supply so far this year, just over $11 billion (~84%) has come from AAA and AA issuers. Only 4% of total supply came from issuers rated BBB or below.


Economic Developments


Some of these rate movements and general uncertainty can be attributed to the Federal Reserve’s continued efforts to curb stubbornly elevated inflation. At the beginning of the year, market participants were estimating 3-6 rate cuts of 25 bps from the Fed this year. As we approach the halfway point in 2024, the conversation has instead turned to whether the Fed will cut rates once or twice this year. The Fed has been clear on what needs to see to begin rate cuts, but economic data released throughout the first quarter showed continued economic resilience and sticky inflation which put cuts on hold. Despite this, there is evidence that inflation is cooling.  The recently released consumer-price index for April showed an increase of 3.4%. Core prices (which exclude food and energy items in the measure’s “basket”) rose only 3.6%, the lowest uptick since April 2021. If this trend continues, it will increase the likelihood of further rate cuts this year, especially if forthcoming data shows material weakening in the labor market.


In short, as we approach the mid-point of the year, the municipal market outlook remains mixed. Issuance volume has rebounded from lower levels in 2023 despite interest rate volatility through the first four months of the year, in a positive development for the municipal market. However, rates remain elevated – the Fed funds rate still sits at its highest level in more than two decades – and will almost certainly remain so until inflation softens further, or the labor market shows signs of weakness, providing the Fed with the data it needs to change course. In the meantime, if you would like to discuss capital plans in the context of these market conditions, please schedule some time to connect with your Blue Rose Advisor.


Comparable Issues Commentary
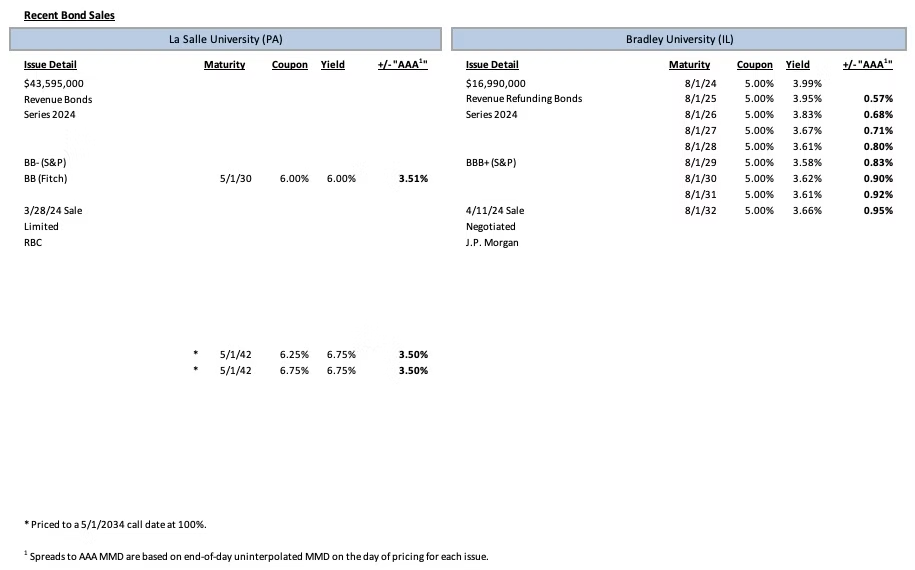
Shown below are the results of two higher education financings that priced in late March and early April. On March 28th, La Salle University issued its tax-exempt Series 2024 Revenue Bonds. Two weeks later, on April 11th, Bradley University priced its tax-exempt Revenue Refunding Bonds, Series 2024. Bradley’s transaction was issued solely to refinance an existing loan. On the other hand, La Salle’s financing was a dual-purpose issuance which refinanced several series of outstanding bonds and also provided funds for various new money capital projects on the University’s campus in Philadelphia. La Salle’s bonds were issued through a limited offering, while Bradley’s were issued through a conventional public offering.


Bradley’s bonds carried a BBB+ rating from S&P Global Ratings, while La Salle’s bonds were rated several notches lower (below investment grade) at BB- and BB from S&P Global Ratings and Fitch Ratings, respectively. La Salle’s financing was the larger of the two, coming in at around $43.6 million in total par amount compared to Bradley’s roughly $17 million of par amount. Bradley’s Series 2024 bonds are noncallable, while La Salle’s feature a standard 10-year call provision in 2034. The structures of the two transactions were quite different. Bradley’s deal was fully serialized from 2024-2032 while La Salle’s transaction had a lone serial maturity in 2030 and two term bonds that both matured in 2042. Couponing was also different across the two financings as Bradley utilized 5% coupons exclusively while La Salle’s bonds had coupons of 6%, 6.25% and 6.75%, respectively.


From mid-March up to La Salle’s pricing on the 28th, rates increased aggressively on the front end of the curve with the first three tenors climbing 16-24 bps. Maturities beyond three years saw more modest upticks of 6-12 bps. On La Salle’s pricing day, MMD moved higher by 5 bps at the 1-year tenor and 3 bps higher on the 2-year tenor while the rest of the curve remained unchanged. La Salle was ultimately able to achieve spreads of 351 bps on its serial maturity and 350 bps on both term bonds. Over the ensuing two weeks, MMD moved higher by 14-23 bps across the curve. On Bradley’s pricing day, MMD moved higher by 3 bps on tenors 1-5 but otherwise remained unchanged for the day. Bradley was ultimately able to achieve spreads of 57-95 bps on its serial maturities.


A noteworthy element of both financings is that they represent two of the very few transactions rated in the BBB or below rating category space that have come to market this year. Since the beginning of 2024, roughly $13.1 billion of higher education and nonprofit bonds have been sold in the market. Of that number, transactions with ratings of BBB+ or below represent only about half a billion dollars - or around 4% - of total issuance volume.


recent bond sales data


Interest Rates

Interest rates table
Interest rates chart


Meet the Author:


In his role of Associate, Ben Pietrek provides analytical and research support to the lead advisory team for Blue Rose’s debt, derivative, and reinvestment transactions for higher education, non-profit, and government clients. He is also responsible for executing pricing opinions and credit and debt capacity analyses.

Prior to Blue Rose, Mr. Pietrek worked for Altra Federal Credit Union where he drafted and filed various mortgage-related legal documents, along with preparing quarterly reports for management and assisted in creating annual reports for FHLB auditors. He has also held internships with Rockaway Capital and the Idea Fund of La Crosse where he assisted with various financial and analytical projects. Mr. Pietrek joined Blue Rose in 2021 as an Analyst.


Media Contact:


Laura Klingelhutz, Marketing Coordinator

952-208-5710


18 views0 comments

Comments


bottom of page