As we’ve passed the mid-year point in 2023, rating agencies have published higher education sector updates and median data for fiscal year 2022. Their commentary along with the supporting data identifies trends observed across both public and private higher education. Additionally, S&P global ratings recently updated its higher ed rating methodology. A summary of the key findings of each rating agency is included below.
S&P Global Ratings
Enterprise Risk Profile Factors:
Industry risk
Economic fundamentals
Market position
Management and governance
Financial Risk Profile Factors:
Financial performance
Financial resources
Debt and contingent liabilities
Once the anchor is established, positive and negative modifiers are applied along with caps and a holistic analysis to arrive at the Stand-Alone Credit Profile (“SACP”). After the incorporation of external factors, S&P arrives at the issuer credit rating. The specific instrument and breadth of the security pledge for the specific issuance or project are then considered before a final issue credit rating is published.
While largely similar to the prior criteria, there are a few key differences:
S&P now utilizes total cash and investments instead of “available resources” (unrestricted net assets for publics and expendable resources for privates)
Slight revision to the weighting of several factors
New criteria outlines more potential “commonly applied qualitative adjustments” that can result in a higher or lower score for each factor
Below are links to the updated methodology and Medians reports. The final link is an interactive tool from S&P to further explore the data.
Moody’s Investors Service
Moody’s published similar public and private commentary at the end of June.
For private institutions, Moody’s made many of the same comments around market performance and its relative impact on cash and investments. Median operating revenue growth was 10.4% in 2022, bolstered by pandemic aid as well as auxiliary revenues. Tuition was also a contributing factor to revenue growth at many institutions – median net tuition growth was 3.3%, although roughly a third of Moody’s rated institutions reported declines in net tuition. Unfortunately, much of this revenue growth was offset by rising operating costs, as median operating expenses increased by 10%.
Fitch Ratings
Last month Fitch Ratings released median reports for its public and private rated entities. The agency holds a deteriorating outlook on the higher education sector as it views conditions as remaining mixed.
The headline of Fitch’s private colleges and universities report states that the “credit gap is widening.” This has been a recurring theme in private higher education over the last few years as enrollment and price-sensitivity challenges remain. Although federal stimulus funds boosted margins, median net tuition and fee revenue fell for the second consecutive year. Fitch also noted that because of outsized investment returns in 2021 and cash preservation efforts undertaken by many institutions, balance sheets across the sector remain strong for the most part. They observed a decline in debt issuance since 2020 and expect borrowing to remain rather muted due to challenging interest rate conditions.
Kroll Bond Rating Agency
While not a medians report like those discussed above, Kroll recently published an article on bias in private higher education ratings. The report argues that other agencies rely too heavily on “vanity metrics” such as number of applicants, rather than financial metrics associated with an institution’s ability to repay its debt. Kroll examined the 15 schools that had payment defaults between 2009 and 2022. They found that several common themes existed between the institutions. Size was a meaningful factor for these institutions – the largest had approximately 3,600 students, while nearly half of the remaining schools had less than 1,000 students. Several schools were located in remote geographies and with some school identities based on religious faith: both limiting factors for attracting new students.
Kroll then conducted a penalized logistic regression (which imposes a penalty to the logistical model for having too many variables and results in the shrinking of less contributive variables toward zero) on eight select financial and demand ratios that identified three ratios (expendable resources to debt, acceptance rate, and expendable resources per student) as important. Specifically, Kroll found that in institutions with high expendable resources to debt and per student, a lower acceptance rate would give a greater probability of that institution achieving a AAA rating. They opine that in the age of the Common Application, which has greatly expanded applicant pools at many institutions, focusing on matriculation and graduation rates in conjunction with flexibility would yield a more meaningful assessment of the borrower’s ability to repay its obligations.
Comparable Issues Commentary
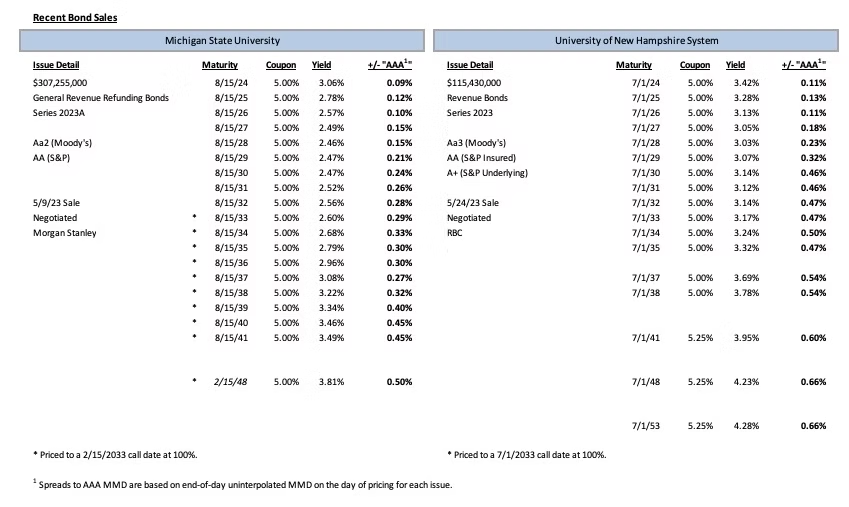
Shown below are the results of two “AA” rated higher education financings that priced in the month of May. While these transactions priced just a few weeks apart, swiftly changing market conditions played a substantial role in the divergent outcomes of the pricings. On May 9th, Michigan State University (“MSU”) priced its tax-exempt Series 2023A General Revenue Refunding Bonds. Roughly two weeks later, the University of New Hampshire System (“UNH”) priced its tax-exempt Series 2023 Revenue Bonds. MSU’s transaction was purely a refunding and served to refinance various components of the University’s outstanding debt including their Series 2013A bonds and portions of the University’s outstanding commercial paper and synthetically fixed rate debt. Proceeds were also used for termination fees related to interest rate swaps that were associated with the refunded bonds. In contrast, UNH’s transaction was a dual-purpose issuance with both refunding and new money components. The new money component served to finance various improvements to Hetzel Hall on the University’s Durham campus. The refunding component refinanced the University’s outstanding Series 2005A and 2005B Bonds as well as the Series 2011B Bonds. Proceeds were also used for termination fees related to interest rate swaps that were associated with the refunded bonds.
Both schools’ bonds carried ratings from Moody’s and S&P. MSU’s bonds were rated Aa2 by Moody’s and an equivalent AA by S&P. UNH’s bonds also carried a AA rating from S&P, though the transaction employed credit enhancement through Build America Mutual. UNH’s underlying ratings were slightly lower at Aa3 and A+ from Moody’s and S&P, respectively. Both transactions were sizeable, with MSU’s total par at $307.255 million and UNH coming in at $115.43 million. Both deals are callable at par in 2033, with MSU on February 15th and UNH on July 1st. Both transactions also used a combination of serial maturities and term bonds. MSU’s transaction was serialized from 2024-2036 and featured maturities across all of those years with bonds maturing on both February 15th and August 15th. It also featured two additional February serial maturities in 2042 and 2043. MSU had term bonds in 2037-2041 as well as a 2048 term bond. UNH’s deal, on the other hand, was fully serialized from 2024-2035 with an additional serial maturity in 2038 and term bonds in 2037, 2041, 2048, and 2053. The couponing of the two deals was similar: MSU used exclusively 5% coupons, while UNH also used 5% coupons on all but its 2041, 2048, and 2053 term bonds, which had 5.25% coupons.
From the beginning of May until MSU’s pricing on the 9th, MMD fell across the curve by 3-7 bps. The front and back ends of the curve saw more modest drops of 3 bps, but the middle of the curve experienced larger decreases of 5-7 bps. On May 9th itself, MSU’s pricing date, the index remained unchanged from the prior day. MSU was ultimately able to achieve spreads of 9-46 bps on its serial maturities and 27-50 bps on its term bonds.
UNH, however, did not enjoy the same environment when pricing. Over the ensuing two weeks, MMD shot up aggressively by 26-51 bps. Of these increases, the largest were seen within the first eight years of the curve. On May 24th, UNH’s pricing date, MMD again moved higher by 3-4 bps on tenors 3-11. New Hampshire was able to achieve spreads of 11-54 bps on its serial maturities and 54-66 bps on its term bonds. While the spreads of the two transactions aren’t outside the bounds of what could be expected given the credit differentials of the two schools, the yield differentials are much larger. For example, at the 1-year tenor, MSU and UNH have spreads of 9 and 11 bps, respectively – a difference of only 2 bps. However, UNH’s yield at this point on the curve is 36 bps wider than that of MSU. As another point of reference, at the 15-year point in 2038 (the last comparable 5% maturities between the two transactions), the yield differential is 56 bps between MSU’s 3.22% and UNH’s 3.78%. This demonstrates how impactful benchmark rate movements can be in the span of only a couple of weeks.

Interest Rates


Ben Pietrek | [email protected] | 952-746-6055
Ben Pietrek joined Blue Rose in 2021 and works as an Analyst. In his role Mr. Pietrek is responsible for providing analytical, research, and transactional support to the lead advisory team serving higher education, non-profit, and government clients with debt advisory, derivatives advisory, and reinvestment advisory services. He is also responsible for credit and debt capacity analyses.
Media Contact:
Megan Roth, Marketing Manager
952-746-6056


